Dashboard Overview -Accessing the TXP Dashboard
Dashboard Overview -Accessing the TXP Dashboard
Upon logging in, you’ll be greeted with a detailed overview of your trading account. This section provides real-time insights into your trading performance, equity status, and risk parameters.
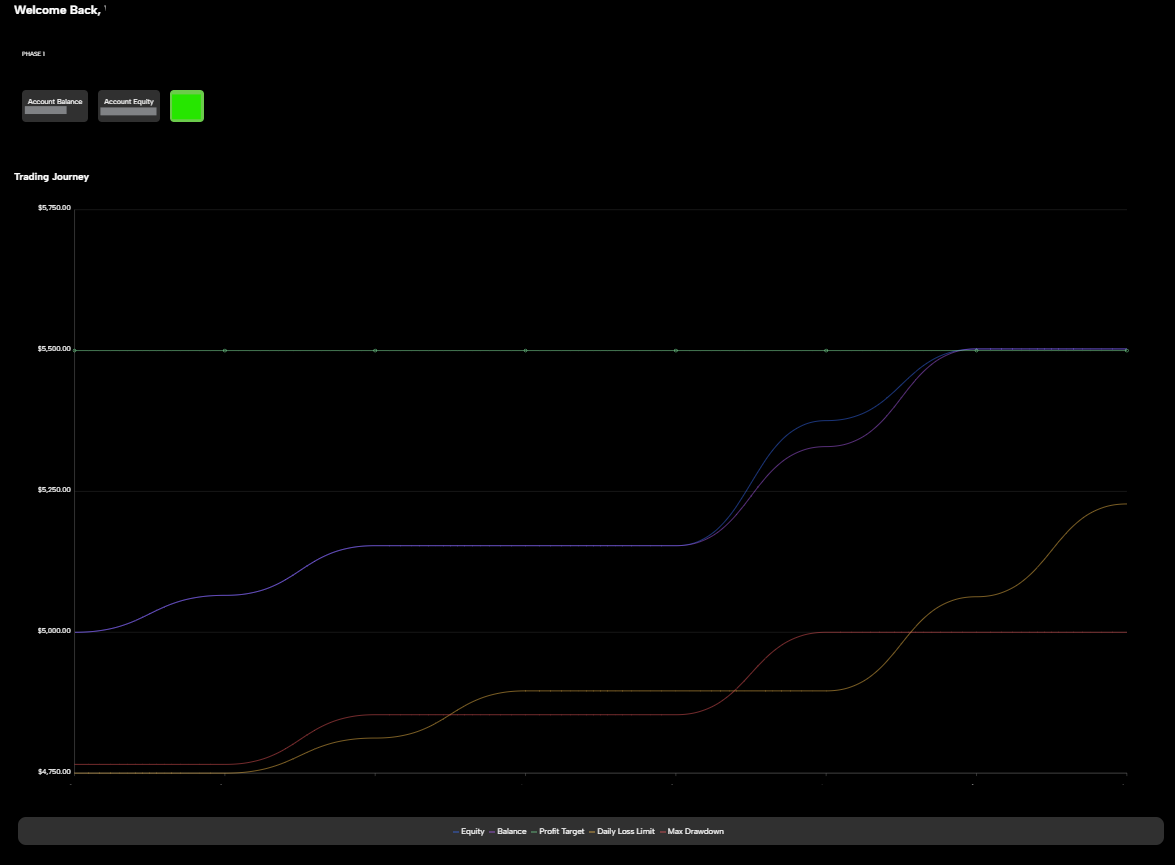
The performance graph visualizes your trading journey by displaying:
📈 Balance – The total amount in your account, including profits and losses.
📉 Equity – Your balance, factoring in open positions.
🚨 Max Drawdown – The maximum amount your account has declined from its peak.
⚠️ Max Daily Loss Limit – The most you can lose in a single day before reaching the limit.
🔑 Viewing Your Credentials & Account Metrics
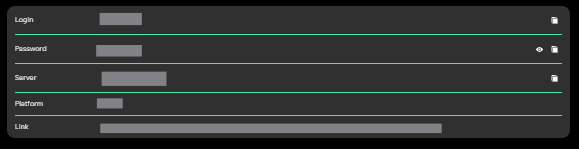
🔹 Login Credentials:
Traders can access their platform login details directly within the dashboard.
This includes server details, account number, and platform credentials.
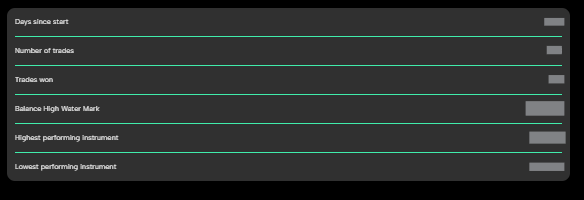
📊 Account Metrics:
View real-time updates on profit, loss, margin, and open trades.
Track performance against evaluation or funded account requirements.
📌 Managing Multiple Accounts
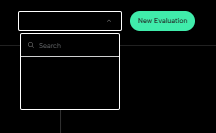
🔄 Switching Between Accounts:
If you have multiple trading accounts, you can toggle between them using the drop-down menu at the top-left corner.
Easily switch views without logging out
❓ Need Help? Contact Us!
💬 Live Chat: Available on tradexprop.com
📩 Email: support@tradexprop.com
🤝 Discord Community: Join Here
🎥 Want a full walkthrough? Watch our video guide here: Watch Now